Analysis of the Crimes in New York City

Anthony

Data Science (CSCI 39542) Fall 2021 Project

Overview

This project is an attempt to raise awareness of the crimes in NYC. I want to display the data on a map to identify any hotspots for crimes or identify any trends. Also, whether COVID increases the number of crimes in NYC. Since COVID, there has been an abundant amount of shocking hate crimes and it has affected me on a personal level. I want to contribute in some way to help the community.

Data

NYC OpenData: NYPD Complaint Data is a dataset of every arrest in NYC ranging from misdemeanor, larceny, to different violation crimes. It includes columns like BORO_NM (the types of borough) which is important to create the bar graph and choropleth maps. CMPLNT_FR_DT (the exact date of the occuring crime) is needed to make the line graphs. The longitude and latitude columns to make the folium maps. NYC OpenData: Borough Boundaries was used to get the geographical features of the boroughs to make the choropleth maps.

Techniques

  • PandaSQL to filter the dataset to get the desired columns

  • Matplotlib.pyplot to create the bar graphs and line graphs

  • Plotly Express and GeoJSON to make the choropleth maps

  • Folium library to make the maps with markers

  • Output the choropleth and folium maps as .html so it can be displayed using HTML Iframes making it interactive

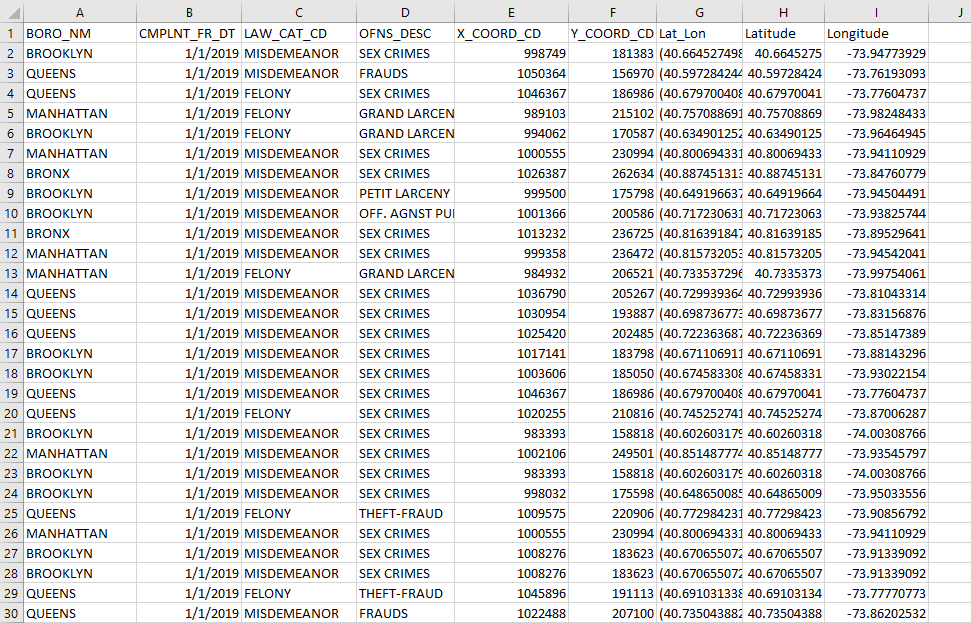
Using PandaSQL to get the desired columns and save it as a .csv file


                        import pandas as pd
                        import pandasql as psql

                        df = pd.read_csv('NYPD_Complaint_Data_Current_Year_To_Date_.csv')
                        # Using pandasql to pick out the desire columns
                        newDF = psql.sqldf("""
                            SELECT BORO_NM, CMPLNT_FR_DT, LAW_CAT_CD, OFNS_DESC, X_COORD_CD, Y_COORD_CD, Lat_Lon
                            FROM df
                            ORDER BY CMPLNT_FR_DT ASC
                        """)

                        newDF.to_csv("Specific_Cols.csv", index = False)
                    

fig1


                        import pandas as pd
                        import matplotlib.pyplot as plt

                        df = pd.read_csv('Specific_Cols.csv')
                        print(df['BORO_NM'].value_counts())
                        # Making Bar Graph of the Total # of Crimes from each Borough
                        print(df['BORO_NM'].value_counts().plot(kind = "bar"))
                        plt.xticks(rotation=0, horizontalalignment="center")
                        plt.title("Total Number of Crimes in each Borough from 2019 to 2021")
                        plt.xlabel("Borough", fontsize=12, labelpad=10)
                        plt.ylabel('Number of Crimes',fontsize=12, labelpad=10)
                        # Putting values above each bar of bar graph
                        boroNumsY = [91122, 79229, 69912, 67724, 13801]
                        for i in range(5):
                            plt.text(i, boroNumsY[i], boroNumsY[i], ha='center', va='bottom')
                        plt.show()
                    

fig1

Line graphs comparing the number of crimes in 2019, 2020, and 2021

fig1 fig1


                        #GeoJSON: https://data.cityofnewyork.us/City-Government/Borough-Boundaries/tqmj-j8zm
                        import pandas as pd
                        import json
                        import plotly.express as px 

                        df = pd.read_csv('Specific_Cols.csv') 
                        #Making two columns, one is the borough name and the second is the count of crimes in each borough
                        newDF = pd.DataFrame()
                        newDF = df
                        newDF['CMPLNT_FR_DT'] = pd.to_datetime(newDF['CMPLNT_FR_DT'])

                        #Filtering only 2019
                        mask = (newDF['CMPLNT_FR_DT'] < '2020-1-1') 

                        newDF = newDF.loc[mask]
                        newDF = newDF['BORO_NM'].value_counts().reset_index()
                        newDF = newDF.rename({'index':'BORO_NM','BORO_NM':'Count'}, axis=1)
                        newDF['BORO_NM'] = newDF['BORO_NM'].str.title()

                        #Load geojson to get the geographical features of the boroughs 
                        nyBoro = json.load(open('Borough Boundaries.geojson', 'r'))

                        #See the id of each borough in geojson 
                        boro_id_map = {}
                        for feature in nyBoro['features']:
                            feature['id'] = feature['properties']['boro_code']
                            boro_id_map[feature['properties']['boro_name']] = feature['id']

                        #Getting the id number of each borough
                        newDF['id'] = newDF['BORO_NM'].apply(lambda x: boro_id_map[x])

                        #Making the choropleth map
                        fig = px.choropleth_mapbox(newDF, locations='id', geojson=nyBoro, color='Count', hover_name='BORO_NM', 
                                hover_data=['Count'], mapbox_style='carto-positron', center={'lat': 40.7, 'lon': -74}, opacity=0.5)
                        fig.show()
                        fig.write_html('choropleth2019.html')
                    

Choropleth map of the number of crimes in 2019


                        #GeoJSON: https://data.cityofnewyork.us/City-Government/Borough-Boundaries/tqmj-j8zm
                        import pandas as pd
                        import json
                        import plotly.express as px 

                        df = pd.read_csv('Specific_Cols.csv') 
                        #Making two columns, one is the borough name and the second is the count of crimes in each borough
                        newDF = pd.DataFrame()
                        newDF = df
                        newDF['CMPLNT_FR_DT'] = pd.to_datetime(newDF['CMPLNT_FR_DT'])
 
                        #Filtering only 2020
                        mask = (newDF['CMPLNT_FR_DT'] >= '2020-1-1') & (newDF['CMPLNT_FR_DT'] < '2021-1-1')

                        newDF = newDF.loc[mask]
                        newDF = newDF['BORO_NM'].value_counts().reset_index()
                        newDF = newDF.rename({'index':'BORO_NM','BORO_NM':'Count'}, axis=1)
                        newDF['BORO_NM'] = newDF['BORO_NM'].str.title()

                        #Load geojson to get the geographical features of the boroughs 
                        nyBoro = json.load(open('Borough Boundaries.geojson', 'r'))

                        #See the id of each borough in geojson 
                        boro_id_map = {}
                        for feature in nyBoro['features']:
                            feature['id'] = feature['properties']['boro_code']
                            boro_id_map[feature['properties']['boro_name']] = feature['id']

                        #Getting the id number of each borough
                        newDF['id'] = newDF['BORO_NM'].apply(lambda x: boro_id_map[x])

                        #Making the choropleth map
                        fig = px.choropleth_mapbox(newDF, locations='id', geojson=nyBoro, color='Count', hover_name='BORO_NM', 
                                hover_data=['Count'], mapbox_style='carto-positron', center={'lat': 40.7, 'lon': -74}, opacity=0.5)
                        fig.show()
                        fig.write_html('choropleth2020.html')
                    

Choropleth map of the number of crimes in 2020


                        #GeoJSON: https://data.cityofnewyork.us/City-Government/Borough-Boundaries/tqmj-j8zm
                        import pandas as pd
                        import json
                        import plotly.express as px 

                        df = pd.read_csv('Specific_Cols.csv') 
                        #Making two columns, one is the borough name and the second is the count of crimes in each borough
                        newDF = pd.DataFrame()
                        newDF = df
                        newDF['CMPLNT_FR_DT'] = pd.to_datetime(newDF['CMPLNT_FR_DT'])

                        #Filtering only 2021
                        mask = (newDF['CMPLNT_FR_DT'] >= '2021-1-1') 

                        newDF = newDF.loc[mask]
                        newDF = newDF['BORO_NM'].value_counts().reset_index()
                        newDF = newDF.rename({'index':'BORO_NM','BORO_NM':'Count'}, axis=1)
                        newDF['BORO_NM'] = newDF['BORO_NM'].str.title()

                        #Load geojson to get the geographical features of the boroughs 
                        nyBoro = json.load(open('Borough Boundaries.geojson', 'r'))

                        #See the id of each borough in geojson 
                        boro_id_map = {}
                        for feature in nyBoro['features']:
                            feature['id'] = feature['properties']['boro_code']
                            boro_id_map[feature['properties']['boro_name']] = feature['id']

                        #Getting the id number of each borough
                        newDF['id'] = newDF['BORO_NM'].apply(lambda x: boro_id_map[x])

                        #Making the choropleth map
                        fig = px.choropleth_mapbox(newDF, locations='id', geojson=nyBoro, color='Count', hover_name='BORO_NM', 
                                hover_data=['Count'], mapbox_style='carto-positron', center={'lat': 40.7, 'lon': -74}, opacity=0.5)
                        fig.show()
                        fig.write_html('choropleth2021.html')
                    

Choropleth map of the number of crimes in 2021


                            #Reference: https://medium.com/analytics-vidhya/generating-maps-with-python-maps-with-markers-part-2-2e291d987821
                            import pandas as pd
                            import folium
                            from folium import plugins 

                            df = pd.read_csv('Specific_Cols.csv') 
                            df['CMPLNT_FR_DT'] = pd.to_datetime(df['CMPLNT_FR_DT'])
                            #Filtering only 2019
                            mask = (df['CMPLNT_FR_DT'] < '2020-1-1') 
                            df = df.loc[mask]

                            nyc_map = folium.Map(location=[40.7128, -74.006], zoom_start=11)

                            incidents = plugins.MarkerCluster().add_to(nyc_map)

                            for lat, lng, label, in zip(df.Latitude, df.Longitude, df.OFNS_DESC):
                                folium.Marker(
                                location=[lat, lng],
                                icon=None,
                                popup=label,
                            ).add_to(incidents)

                            nyc_map.save('Folium2021MarkerCluster.html')
                        

Folium map of the types of crimes in 2019


                            #Reference: https://medium.com/analytics-vidhya/generating-maps-with-python-maps-with-markers-part-2-2e291d987821
                            import pandas as pd
                            import folium
                            from folium import plugins 

                            df = pd.read_csv('Specific_Cols.csv') 
                            df['CMPLNT_FR_DT'] = pd.to_datetime(df['CMPLNT_FR_DT'])
                            #Filtering only 2020
                            mask = (df['CMPLNT_FR_DT'] >= '2020-1-1') & (df['CMPLNT_FR_DT'] < '2021-1-1')

                            nyc_map = folium.Map(location=[40.7128, -74.006], zoom_start=11)

                            incidents = plugins.MarkerCluster().add_to(nyc_map)

                            for lat, lng, label, in zip(df.Latitude, df.Longitude, df.OFNS_DESC):
                                folium.Marker(
                                location=[lat, lng],
                                icon=None,
                                popup=label,
                            ).add_to(incidents)

                            nyc_map.save('Folium2021MarkerCluster.html')
                        

Folium map of the types of crimes in 2020

Citations